Remote Sensing - Satellite#
Satellites measure either the solar radiation that is reflected from the Earth and the atmosphere back to space, the thermal radiation that is emitted from the Earth and the atmosphere (passive remote sensing) or the signal coming from an active source (active remote sensing). For this reason, measurements based on passive remote sensing instruments do not send signals themselves, but measure radiation from other sources. The instruments presented here work on this physical principle.
The way satellites measure the concentrations of pollutants and gaseous species is indirect. Satellites themselves do not sample the number of molecules but measure their effect on radiation. Passive optical instruments measure radiation at selected wavelengths that are for example sensitive to the absorption of specific molecules. The key is a kind of fingerprint that different gasses and aerosols leave on the measured radiation and then such effect is converted to the amount of atmospheric components. The intensity of absorption is in fact proportional to the amount of absorbers (e.g. the target gas molecules). By selecting measured radiation on different wavelengths, different gases can be observed. The direct quantification of aerosol amount in an atmospheric column is somewhat more complex, since remote sensing instruments provide aerosol optical depth, which is the column-integrated extinction (scattering + absorption) caused by aerosols. However, aerosol extinction, and thus aerosol optical depth, are intrinsically related to the amount of aerosols in the atmosphere. Aerosol presence can also be inferred from changes in light polarization that have a different behavior while interacting with particles and molecules.
The radiation (or reflectance, thermal emissivity, brightness temperature) measured by the satellite at different wavelengths is known as Level 1 data. To obtain the so-called geophysical parameters (e.g. atmospheric concentrations or optical depth) (Level 2 data), Level 1 data are used as input data for a specific retrieval algorithm. Level 2 data are geo-referenced e.g. have a corresponding latitude and longitude of sensing. Data can be representative of a vertical atmospheric column (derived from the slant column) or of specific layers, providing information on the vertical profile. Datasets introduced in this course are total atmospheric (or tropospheric) columns. Level 3 provides regularly spaced data, that facilitate the comparison of satellite observations to models and analysis, implying averaging or accumulation on a grid cell.
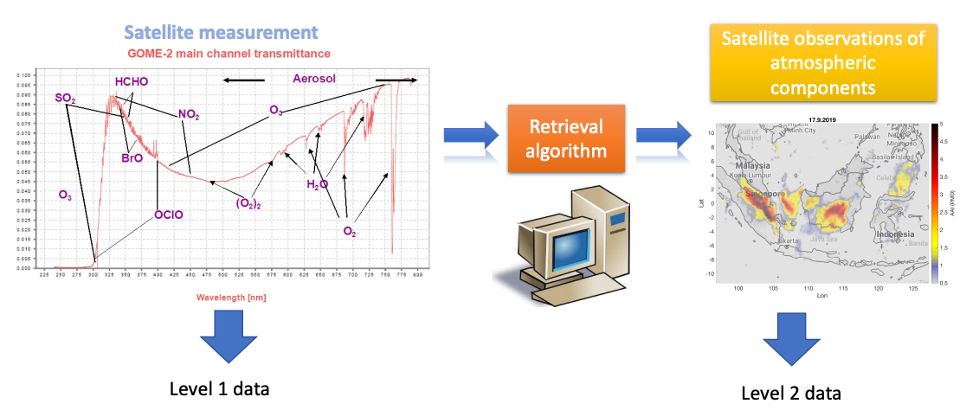
Fig. 2 Basic principles of passive satellite measurements - from Level 1 to Level 2 data (Source: Anu-Maija Sundstrom, FMI and EUMETSAT)#
Limitations of passive satellite measurements
Passive satellite instruments cannot see aerosols or atmospheric compounds below clouds. Clouds block the satellite’s view to the ground absorbing and reflecting the radiation. As a consequence, for cloudy parts, no data can be provided. Aersol index and gases can be retrieved for partly cloudy scenes, although for gases the uncertainty increases. This is because both of these parameters are obtained using the absorption information from the satellite measured radiation. For Aerosol Optical Depth (AOD) we look at reflectance levels (not absorption features), even small cloud effect can disturb the signal so bad that accurate retrieval is not possible.
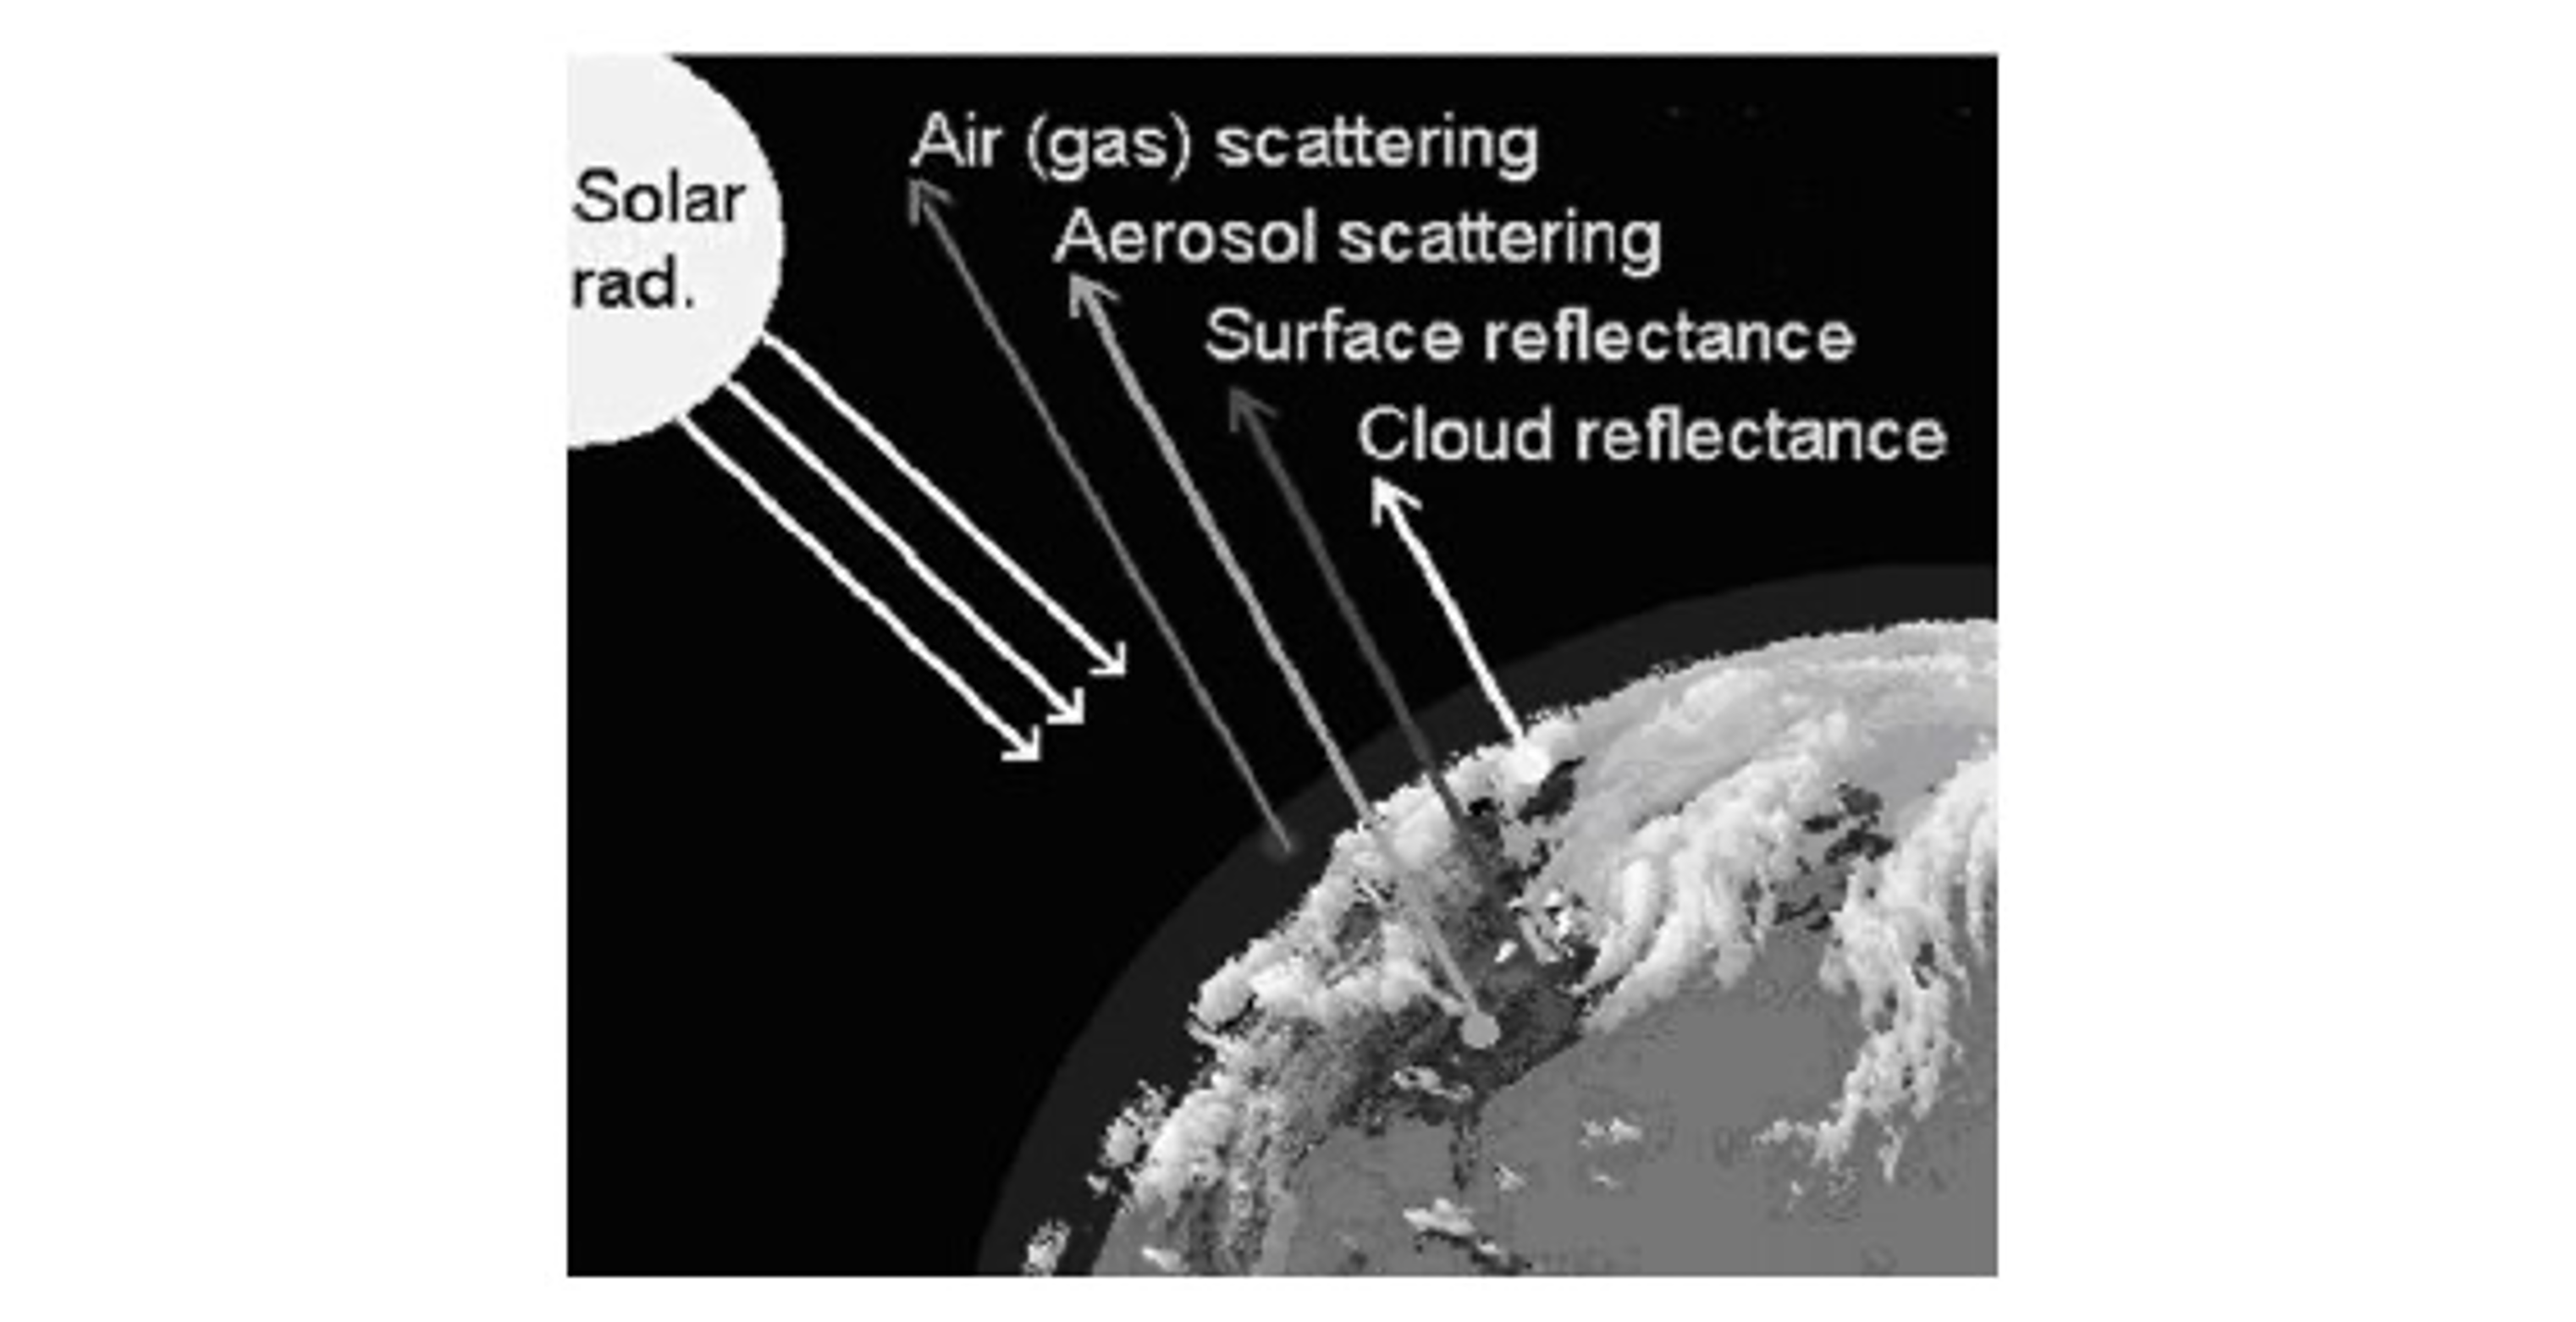
Fig. 3 Principles of passive satellite remote sensing (Source Rudolf Husar)#
Attention must also be paid to the characteristics of the surface where terrestrial reflection takes place. Aerosol retrieval is dependent on the surface albedo. One specific example is sunglint, which is a phenomenon that happens when sunlight reflects off the ocean surface in the same angle as the satellite is viewing the surface. For Level 1 data, sunglint results into south to north stripes on a RGB image and can easily be misinterpreted as dust. For Level 2 AOD retrievals, sunglint prevents retrieval, which results in no data. For Level 2 Absorbing Aerosol Index (AAI) retrievals, sunglint results in an artefact, which usually is filtered out by the retrieval algorithm.
Operational satellite instruments monitoring atmospheric composition#
Figure below provides a selection of current operational satellite instruments monitoring atmospheric composition. Additionally to those provided in the Figure, the SEVIRI instrument onboard the Meteosat Second Generation (MSG) satellites operated by EUMETSAT further provides RGB composite information.
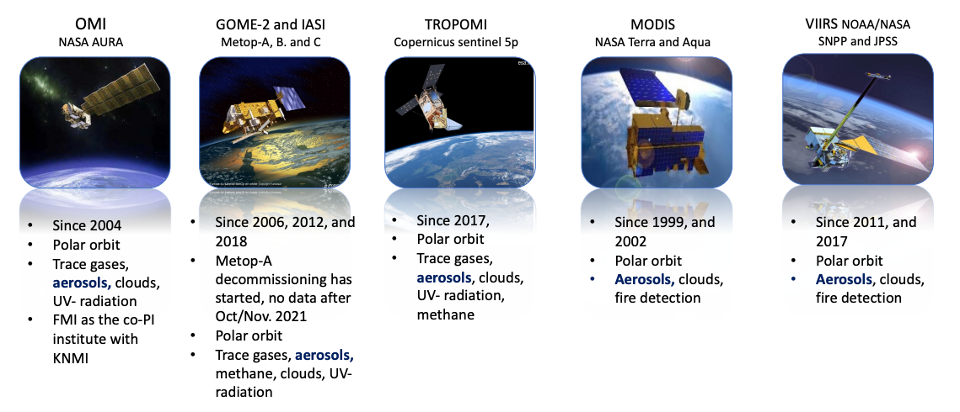
Fig. 4 Examples of current operational satellite instruments monitoring atmospheric composition (Source: Anu-Maija Sundstrom, FMI)#
In this course, the following RGB composites (Level 1) and atmospheric composition products (Level 2 and Level 3) are introduced:
Level 1 |
Level 2 |
Level 3 |
|
|---|---|---|---|
MSG SEVIRI |
|||
Terra/Aqua MODIS |
|||
Sentinel-5P TROPOMI |
|||
Metop-A/B/C GOME-2 and IASI |
|||
Multi-Sensor |
Level 1 RGB images#
True color RGB images from satellites#
True color Red-Green-Blue (RGB) image composite is a technique to display the color imagery by using the property of the three primary colors of the light. A RGB image composite from satellite observations is created from (calibrated) radiances, e.g. Level-1 data. Please note that true color RGB composites require sunlight. Dust appears as brownish / yellowish colour in RGB images.
True color RGB images can be created from polar orbiting and geostationary satellites:
Polar orbiting satellites
Polar orbiting satellites have a global coverage and provide for each location one observation (sometimes two) per day about the same time. Examples for polar orbiting satellites are e.g. Sentinel-5P or NASA Terra and Aqua. Dust apprears always quite similar in RGB images from polar orbiting satellites.
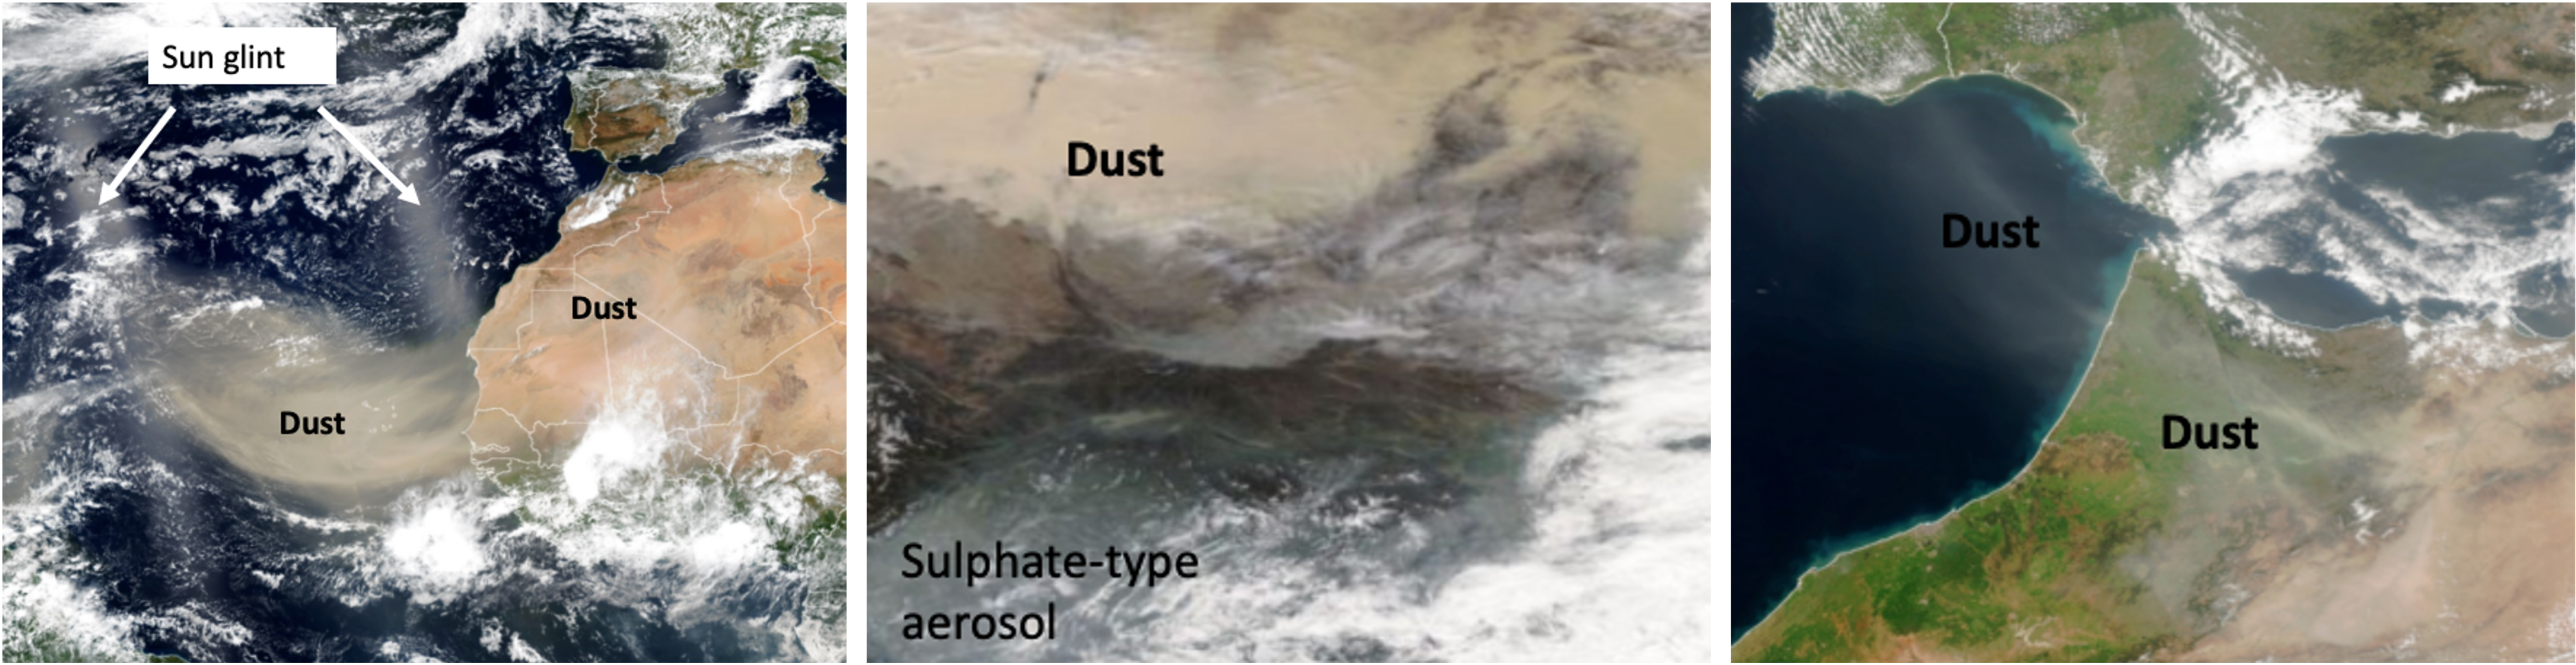
Fig. 5 Dust in RGB images from polar orbiting satellites - Terra/Aqua MODIS (Source: NASA)#
Geostationary satellite
Geostationary satellites have a restricted observation area, but offer a higher temperal resolution. The Meteosat Second Generation satellites are geostationary and offer observations every 15 minutes during daytime. From geostationary satellites, the appearance of dust features are related to the changes in the solar angle. Because of the changing observation time and solar angle, dust phenomena might appear more severe than they are in reality, especially when the sun stands quite low. This is important to remember when interpreting dust from RGB composites from geostationary satellites.
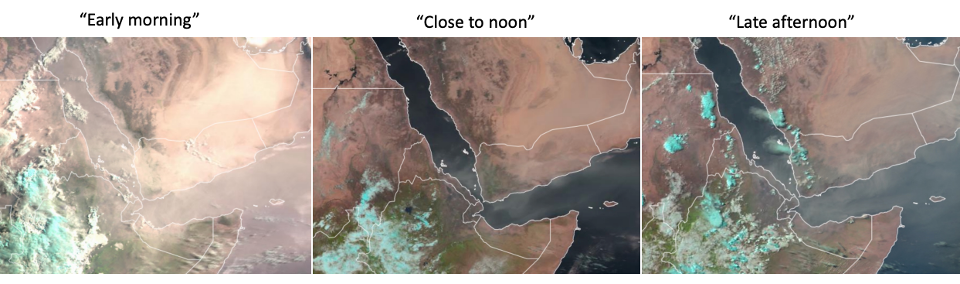
Fig. 6 Dust in RGB images from geostationary satellites during different observation times - MSG Seviri Natural Color RGB product (Source: EUMETSAT)#
Dust indices based on Brightness Temperature#
There are dust indices based on Brightness Temperature (which is a radiation parameter). These indices are based on spectral characteristics of dust in thermal channels. These type of indices are obtained by very simple band calculations, e.g. you use the brightness temperature from one channel and subtract it from the brightness temperature from another channel. An advantage of these indices is that dust features are observed by using longer wavelength information. Hence, there is no longer the need for solar radiation.
MSG SEVIRI Dust RGB composite product
One example of a dust index product is the Dust RGB composite product that can be created from Meteosat SEVIRI Level 1 data. The product is based on combining measurements from three different infrared channels:
Red: IR12 - IR10.8
Green: IR10.8 - IR8.7
Blue: IR10.8
The color interpreation of the product is as follows: dust appears in pink / violet, thick high/mid-level clouds appear in organge / brown and thin cirrus clouds appear as black / darkgreen. The advantages of this product are that it is available night and day with a 15 minute temporal resolution and it gives helpful additional information on cirrus clouds or dry/humid air masses.
The limitations of this product are that it does not indicate the concentration or height of the dust plume. Further, the interpretation is not always straightforward and especially the detection of thin and low level dust over ocean is often quite difficult. For this reason, it is recommended to analyse these products together with other satellite products in order to get a more detailed picture.
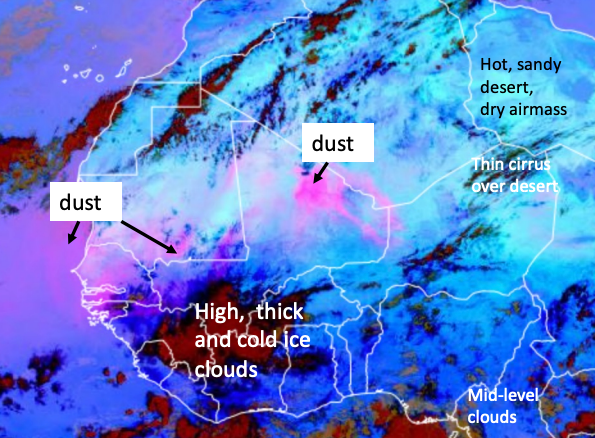
Fig. 7 MSG Seviri Dust RGB composite product (Source: EUMETSAT)#
Retrieved parameters (Level 2 and Level 3 products)#
Aerosol Optical Depth#
The most well-known and most used aerosol-describing parameter is the Aerosol Optical Depth. Common abbreviations are AOD or AOT, which stands for Aerosol Optical Thickness. AOD is related to the amount of (optically active) aerosols in the total atmospheric column. This means that a high AOD means more aerosols and a low AOD means less aerosols, respectively. AOD can be retrieved from satellites and ground-based instruments.
AOD is defined as the sum of aerosol extinction at all atmospheric levels, from surface up to the top of the atmosphere. The parameter is unitless and wavelength dependent. It is often provided at 550 nm. AOD at longer wavelengths is typically lower than at shorter wavelengths and with this information rough estimations of the aerosol type can be made. Typically, during a dust event, also longer wavelengths indicate elevated AOD levels. A limitation of AOD is that is does not provide any information of the vertical distribution of aerosols. The same AOD, e.g. 0.3 can be obtained for very different cases, e.g. a layer of urban aerosols on the surface vs. a dust layer higher up in the atmosphere.
AOD is available from several satellite instruments, e.g. OLCI, SLSTR (Sentinel-3), AATSR (Envisat, until 2012), MODIS (Aqua, Terra), MISR (Terra), VIIRS (Suomi NPP, NOAA 20), SeaWIFS or multi-instrument products, e.g. PMAp (combining information from GOME-2, AVHRR, IASI). Depending on which region of the world we are, we can also indicate the source of aerosols (see Figure below).
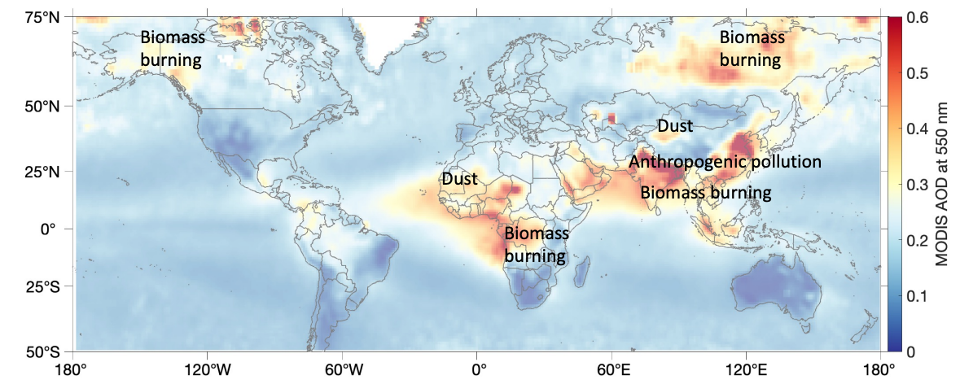
Fig. 8 Aerosol Optical Depth product from MODIS Terra 2019, processed by the Deep Blue Algorithm (Source: NASA)#
Absorbing Aerosol Index#
Absorbing Aerosol Index (AAI) is also known as UV Aerosol Index (UVAI) and can only be retrieved from instruments that operate at ultraviolet wavelengths, typically 340-380nm (GOME-2, TROPOMI, OMI, OMPS). AAI is sensitive to absorbing aerosols, hence it is a good tracer for dust, smoke and ash plumes. Positive AAI values indicate presence of absorbing aerosols and absorbing aerosol plumes have typically an AAI value higher than 1. For clouds (or scattering aerosols) AAI is close to zero or negative. Sunglint over oceans may cause positive AAI values, which are often already filtered out from the data.
The strength of AAI is that it is not sensitive to clouds. This means AAI can also be obtained from cloud scenes, when aerosols are on top of the clouds.
The limitation of AAI is that the interpretation is often not straightforward. It is important to remember that AAI is not a direct measure of aerosol loading. With AAI you typically see an elevated plume, but does not provide you an indication of the amount of aerosols. Hence, to obtain a more detailed view on the dust plume, it is recommended to combine the AAI with information on AOD. AOD gives more detailed information on spatial variation of aerosol loading, also for places where dust is close to the surface, but often misses parts of the plume, especially for cloudy / partly cloudy scenes. AAI in turn gives more detailed information about the extent of the dust plume, also for cloudy / partly cloudy scenes.
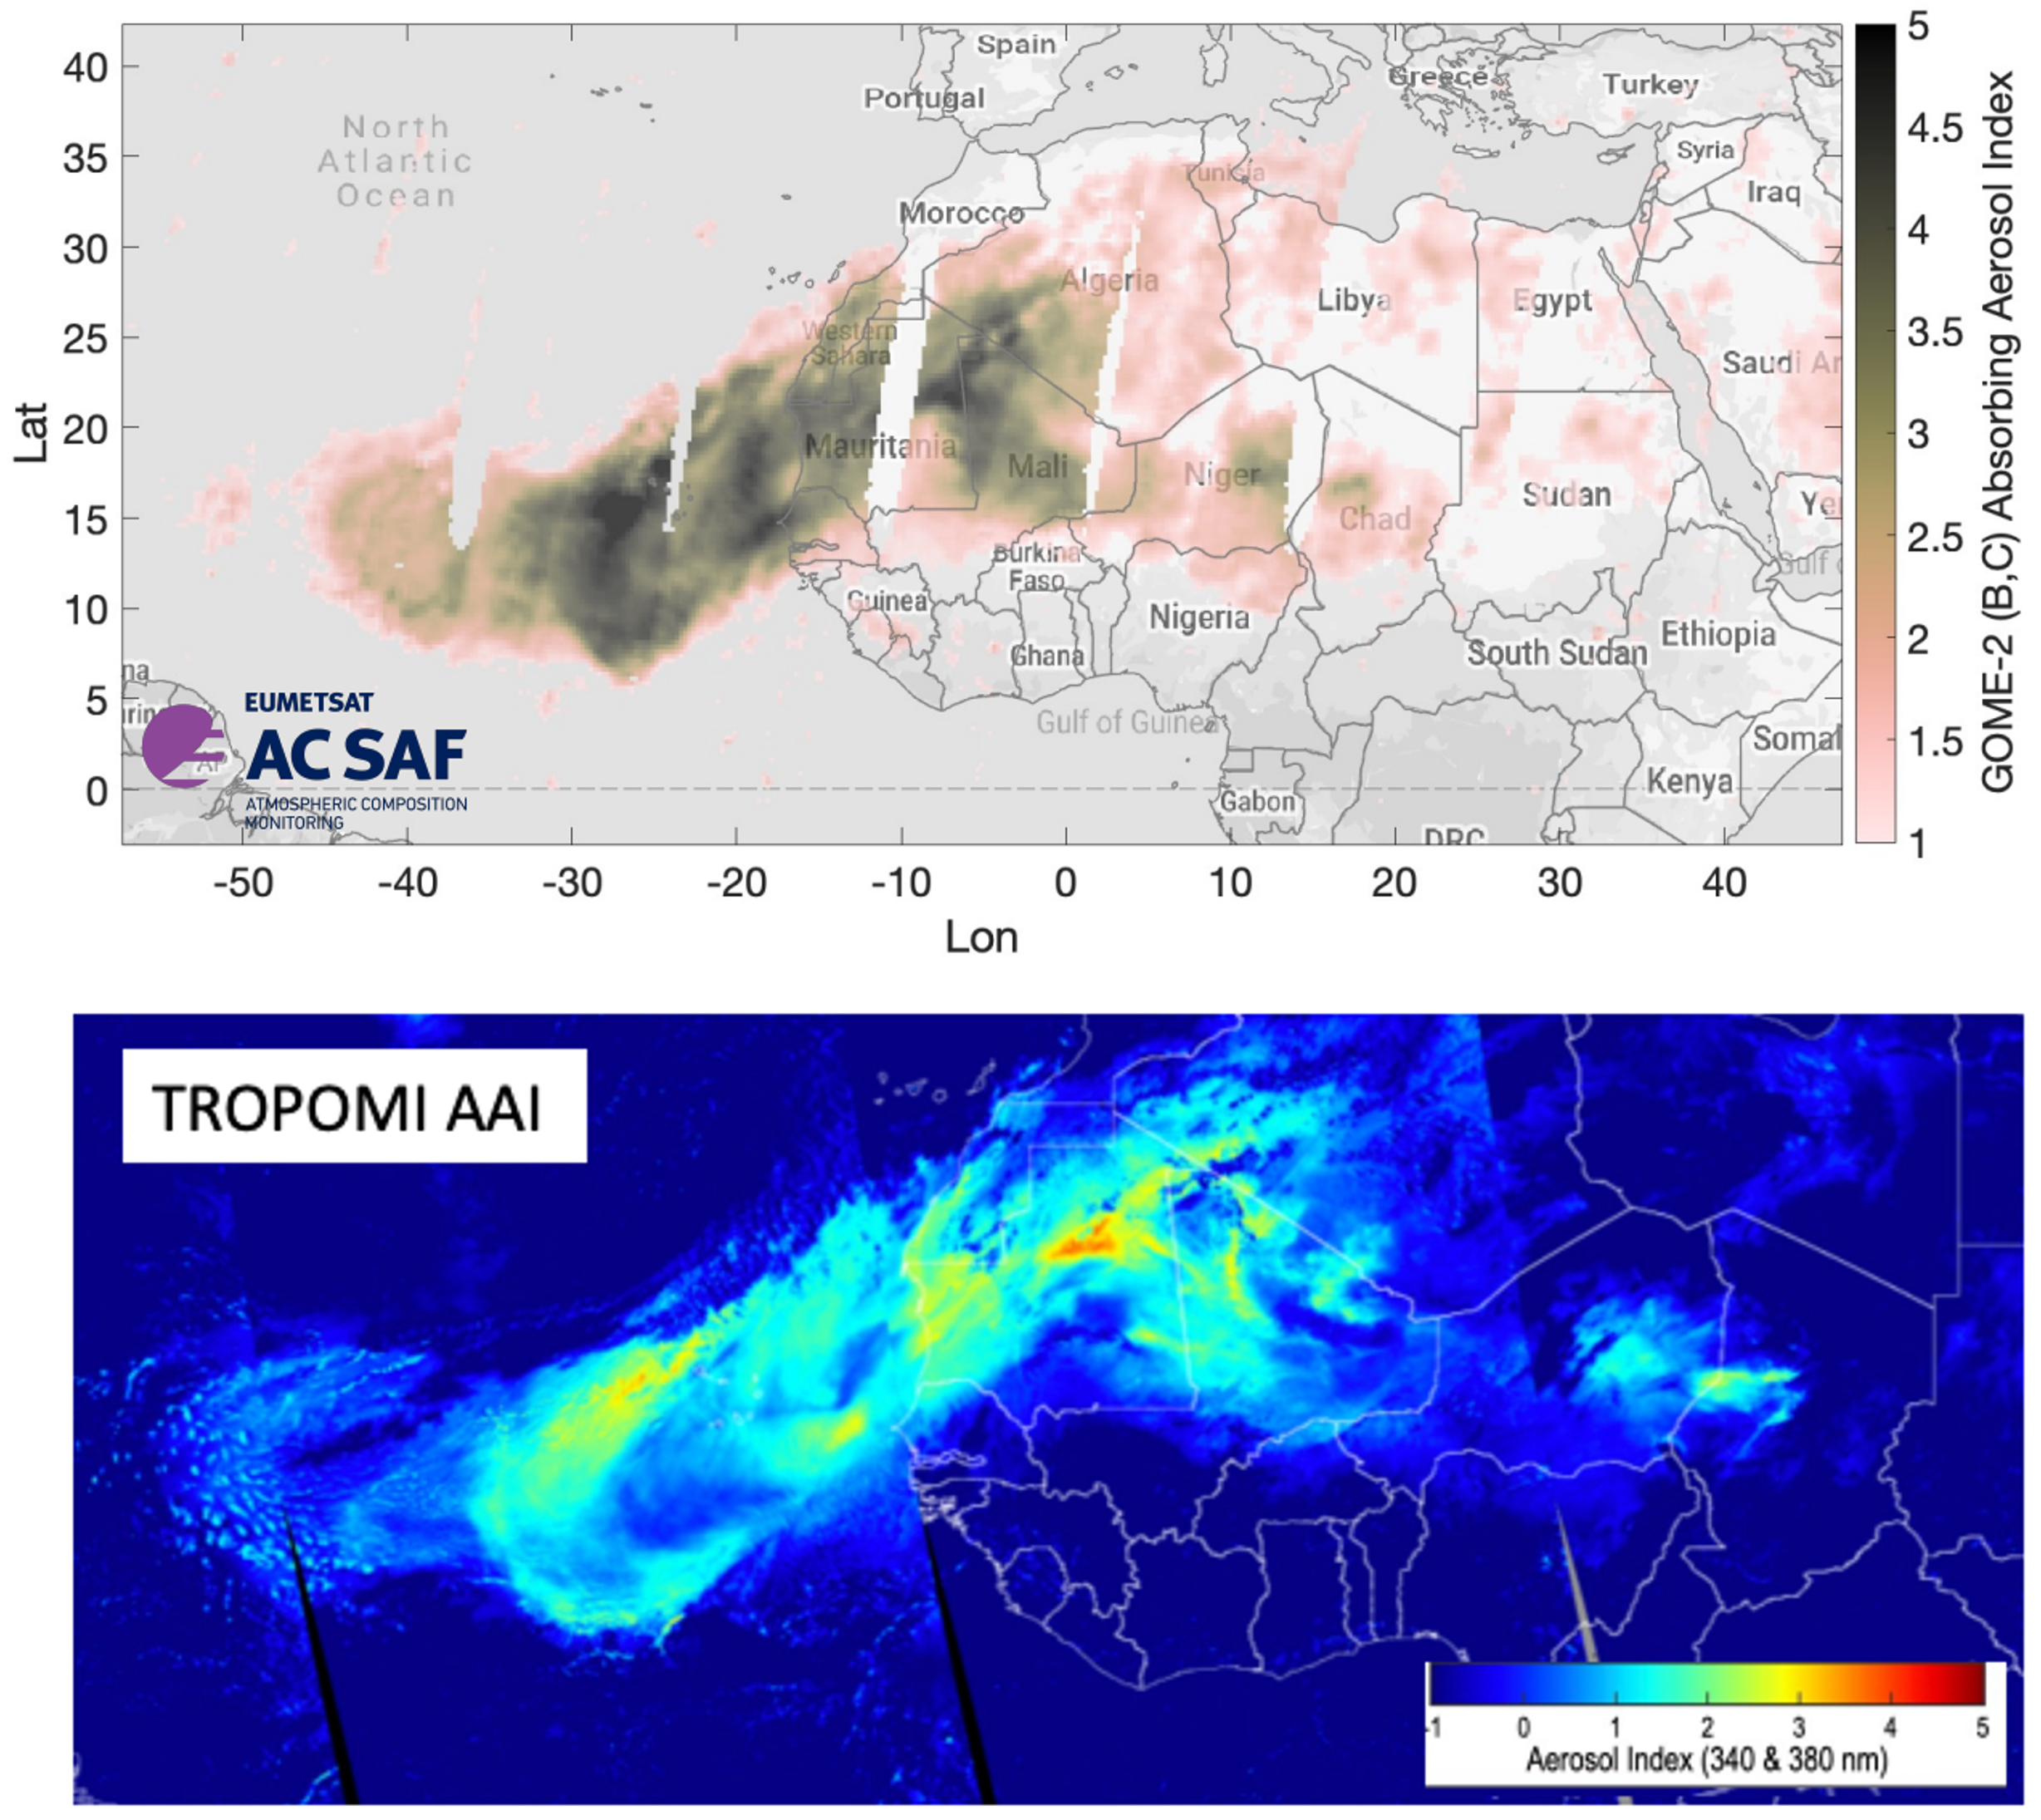
Fig. 9 Absorbing Aerosol Index (AAI) on 7 June 2021 retrieved from Metop-B and -C GOME-2 (top) and TROPOMI (bottom) (Source: EUMETSAT AC SAF and Copernicus)#
Absorbing Aerosol Height#
Absorbing Aerosol Height (AAH) is a relatively new product retrieved from the GOME-2 or TROPOMI instruments. AAH can give you information on the height of the absorbing aerosol layer, but should always be analysed together with AAI. If a pixel has an AAI < 2, the corresponding AAH pixel has a fill value, as the aerosol amount is too low to result in a reliable AAH. If the AAI is larger than 2 and lower than 4, the aerosol layer is not in all cases thick enough for a reliable AAH retrieval. In this case, the AAH estimate is provided, but should be used with caution. In summary, high quality AAH can only be retrieved for pixels where the AAI is high enough. Additionally, the AAH is usually only retrieved for parts of the plume (see Figure below).
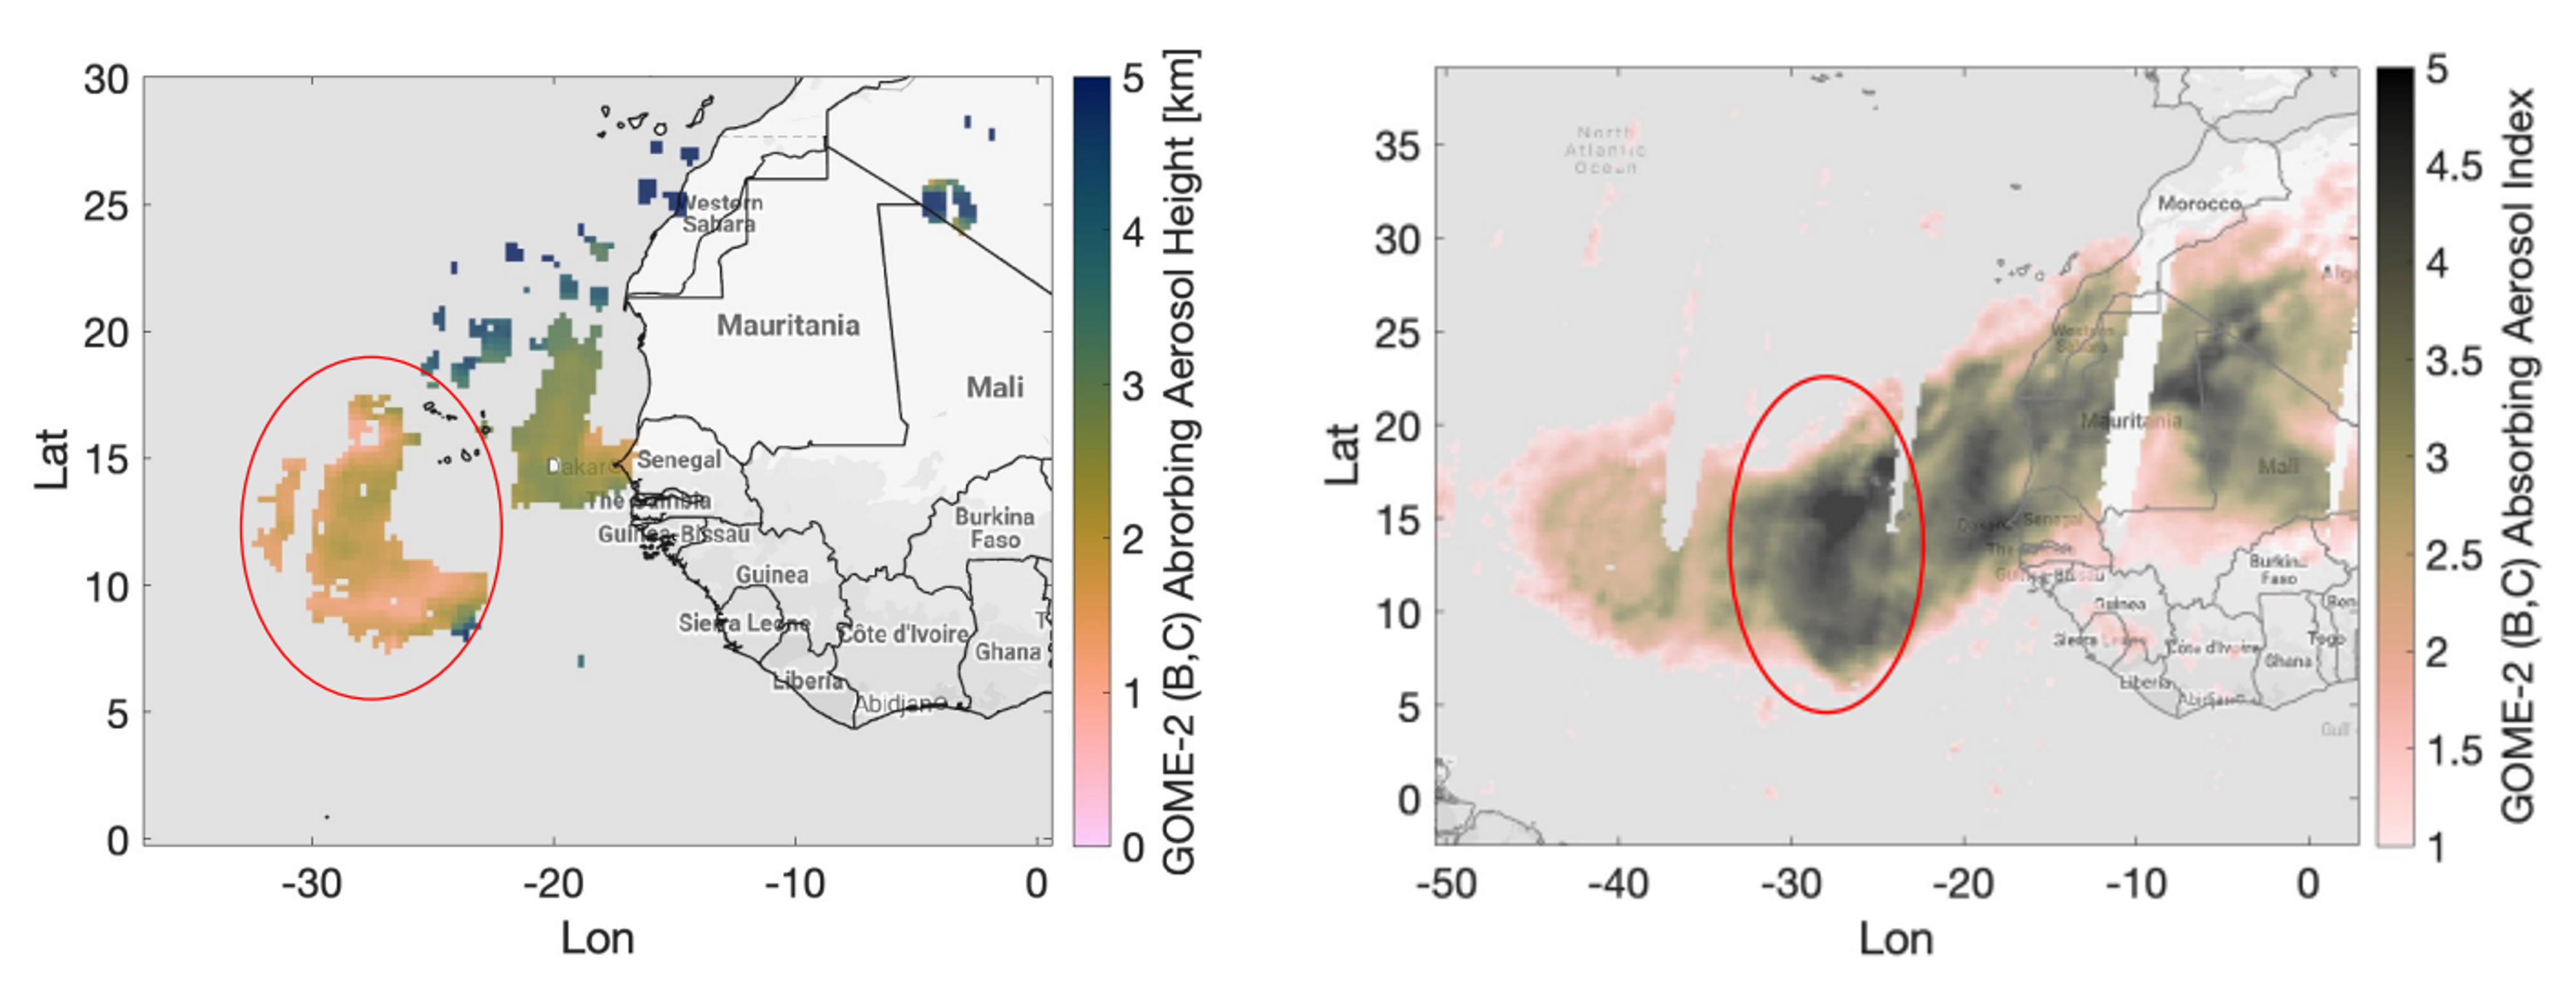
Fig. 10 Absorbing Aerosol Height (left) compared with Absorbing Aerosol Index (right) on 7 June 2021 (Source: EUMETSAT AC SAF)#
Take Home Messages#
Passive satellite observations provide various parameters for monitoring dust events
True color RGB composites are available from several web-based services in near real time, but interpretation is not always straightforward
Aerosol Optical Depth provides an estimate of aerosol loading of all aerosol types
Absorbing Aerosol Index indicates the presence of absorbing aerosols (elevated plumes), including dust
Absorbing Aerosol Height gives an estimate on the height of an absorbing aerosol layer, when the signal is strong enough
Comprehensive view on dust episodes can be obtained by combining observations of RGB, AOD, AAI and AAH!
References#
Data services to obtain RGB and composite images (near real-time)
Web services for viewing aerosol observations
Data services to download aerosol observations
EUMETSAT Earth Observation Portal: PMAp AOD
NASA Earthdata services: MODIS AOD
AC SAF data portal: GOME-2 AAI and AAH